Case Study: Software Competitor Analysis
by Wyatt "Miller" Miller
Introduction
The Scenario
At the request of the client (Company X), the information in this case study has been anonymized.
Company X is a bleeding-edge software development firm, specializing in fast-tracking the agile project management process for medium-sized companies. To enhance productivity, the development team at Company X has created an independent project management platform which has become wildly successful with smaller-sized companies and can now be leased as a stand-alone product.
A project manager from Company X wants to examine the pricing structure of this project management tool. Specifically, she believes that the tier-based structure is promoting churn and eroding sales, while simultaneously preventing Company X from reaching their target demographic: organizations with 20-25 project collaborators.
Since internal data is severely limited for non-employees, this project must rely on mostly public data.
This project is interesting for several reasons:
- It derives insight from limited/public data
- Preliminary analysis indicates a valuable story is hidden beneath the data, providing an excellent demonstration of information obfuscated within data
- The industry/sector is modern and maintains unexpected trends
Results

This analysis shows that there exists competitive pricing pressure at four critical pricing tier transitions, likely promoting churn and preventing Company X from reaching their target demographic:
- 45% of Company X's organizational clients are facing tier transition in Tiers 1 through 5, representing 29% of all collaborators who use company X's product.
- When organizations consider upgrading from Tier 1 to Tier 2, five competitors offer a lower price than Company X.
- When organizations consider upgrading from Tier 2 to Tier 3, two competitors offer a lower price.
- When organizations consider upgrading from Tier 3 to Tier 4, six competitors offer a lower price.
- When organizations consider upgrading from Tier 4 to Tier 5, four competitors offer a lower price.
Further study (with internal data) is needed to fully prove the project manager's hypothesis that Company X's tier-based pricing structure is promoting churn and eroding sales, while simultaneously preventing the company from reaching its target demographic. However, there is an immediate and probable link between pricing tier transition and churn which can be remedied by implementing one of the following recommendations:
- Eliminate tiers and implement a per-collaborator pricing scheme, aiming to favor the target demographic.
- Decrease the resolution of tiers, paying special attention to the downward pressure and churn potential of Tiers 3 and 4.
- Increase the resolution of tiers, paying special attention to the downward pressure and churn potential of Tiers 3 and 4.
- Reevaluate the current tiers in an effort to reduce cost per tier, paying special attention to the downward pressure and churn potential of Tiers 3 and 4, as well as aiming to favor the target demographic.
Data Story
Put yourself in the position of a rational consumer, already using Company X's project management software. Chances are, your organization is small (5 to 15 software collaborators) and conservative with spending; value is a priority, along with keeping costs low. Your organization is growing to the point where you will need to consider increasing the number of project collaborators, enough to change tiers within Company X's project management product.
However, being a rational consumer, you will of course explore all options:
- The mean of the entire population of collaborators for Company X's product is 15.47. This approaches the expected value for the sector (20.32) and any growing organization can expect to approach this number of collaborators. Thus your organization will likely continue to experience upward pressure to increase the number of collaborators.
- Are there cheaper options?
- It is shown in this analysis that there are multiple competitors to priced lower at every critical pricing tier transition for Company X's product. When facing a jump in pricing, it is likely your organization will consider at least one of these competitors from a cost standpoint.
Analysis
Preliminary Analysis
Company X's collaborative project management software is leased monthly, mostly by smaller software organizations. Price tiers have been established based on the number of organizational collaborators that are allowed digital access to the product. A project manager at Company X believes the pricing tiers are promoting a disproportionate amount of churn, preventing Company X from reaching their target demographic (organizations with 20-25 collaborators). When she brings this to the attention of her superiors, they rebut her claims with the following reasoning:
- The current pricing tiers undercut the majority of the market
- The the majority of churn is occurring in the lower tiers, outside of the company's demographic
- Company X is too young and hasn't established a foothold in the market, promoting the observed churn
In the following figures, we see a visual representation of the superiors' rebuttal against seven same-sector competitors, two of whom offer similar but differently priced products (competitors B and C). These seven competitors are considered the most impactful to Company X's market share, according to Company X's project manager. Throughout this analysis, the total cost (first figure) and per capita cost (second figure) will both be provided for convenience:


The above figures appear to support the superiors' rebuttal that Company X is undercutting the market cost of most competitors at the selected pricing tiers. Notable exceptions in the lower tiers include Competitors A, B.1 (a barebones version of Competitor B's flagship product, B.2), and Competitor G.
The project manager suspects churn is being generated when client organizations grow into needing more collaborators, requiring higher pricing tiers. It is important to note, the price points in the figures above are presented at the last amount of collaborators allowed in any given pricing tier for Company X's product. Thus, Company X is being painted in the best light in these figures since only the lowest cost per capita is being displayed for any given tier. A quick way to investigate if there is any substance to the project manager's claim (without spending resources for a larger study) is to examine the first data point in any pricing tier instead of the last.


The figures above examine the first data point in any given pricing tier, rather than the last, painting a far different picture in terms of Company X's pricing competitiveness. In particular, the per capita cost per collaborator is dramatically higher at all levels.
This warrants deeper investigation of the project manager's hypothesis.
Gathering Data 1
Pricing data for all competitors has been scraped from the web and is considered accurate as of May 28, 2018.
Analysis 1
With the increased resolution of the data (500 data points versus 8), a more complete picture of Company X's pricing competition can be presented.


This raises a potent question: Company X appears to maintain lower pricing than implied in the preliminary analysis, so does there still exist pricing-related churn?
More information is needed to support the project manager's hypothesis.
Gathering Data 2
After much negotiation, an anonymous list of the number of collaborators per company has been provided for the entire population of Company X's clients and is considered accurate as of May 28, 2018.
Analysis 2
This table provides tremendous insight into Company X's consumer properties.


For Company X's entire population of clients, the median is discovered to be 12, the mean 15.47 (approaching the sector mean of 20.32), and the mode 15. This presents a concern as it implies Company X is not reaching the target demographic of 20-25 collaborators per company. The distribution of mean-median-mode does not imply much in the way of upward trend for the population - a desirable quality if Company X wishes to hit its demographic target.
Tier 1 (4-5 collaborators) is omitted from the second figure above due to the binary nature of the bins - not much can be gleaned from a visual representation. The mean is discovered to be 4.84, and the median and mode are both discovered to be 5. The left-skew, order of the mean-median-mode, and distribution of the mean-median-mode implies there may be either an upward trend or downward pressure.
Tier 2 (6-10 collaborators) has a mean of 8.59, a median of 9, and a mode of 10 (the maximum value of the tier). The left-skew, order of the mean-median-mode, and distribution of the mean-median-mode implies either an upward trend or downward pressure.
Tier 3 (11-15 collaborators) has a mean of 13.66, a median of 14, and a mode of 15 (the maximum value of the tier). The left-skew, order of the mean-median-mode, and distribution of the mean-median-mode implies either an upward trend or downward pressure.
Tier 4 (16-25 collaborators) has a mean of 21.26, a median of 22, and a mode of 25 (the maximum value of the tier). The left-skew, order of the mean-median-mode, and distribution of the mean-median-mode implies either an upward trend or downward pressure.
Tier 5 (26-50 collaborators) has a mean of 31.66, a median of 31, and a mode of 28. The right-skew, order of the mean-median-mode, and distribution of the mean-median-mode implies either a downward trend or upward pressure.
Tiers 6 and above will no longer to be included in this analysis, since the five tiers above encompass 97% of Company X's clients and the distributions of higher tiers are very sparse, making statistical inference tenuous at best.
By pivoting the customer bins data and mapping onto the first analysis, support for the project manager's argument begins to take shape:


To increase the impact of the above figures, a bold collaborator-per-bin count can be overlain by multiplying the bin count by the bin number. This represents the total number of collaborators at the various collaborator levels (bins) within each tier, as seen below.


Analysis 3
While the above figures are sufficient to finalize the analysis, an examination of tier transition offers better support in favor of the project manager's hypothesis:
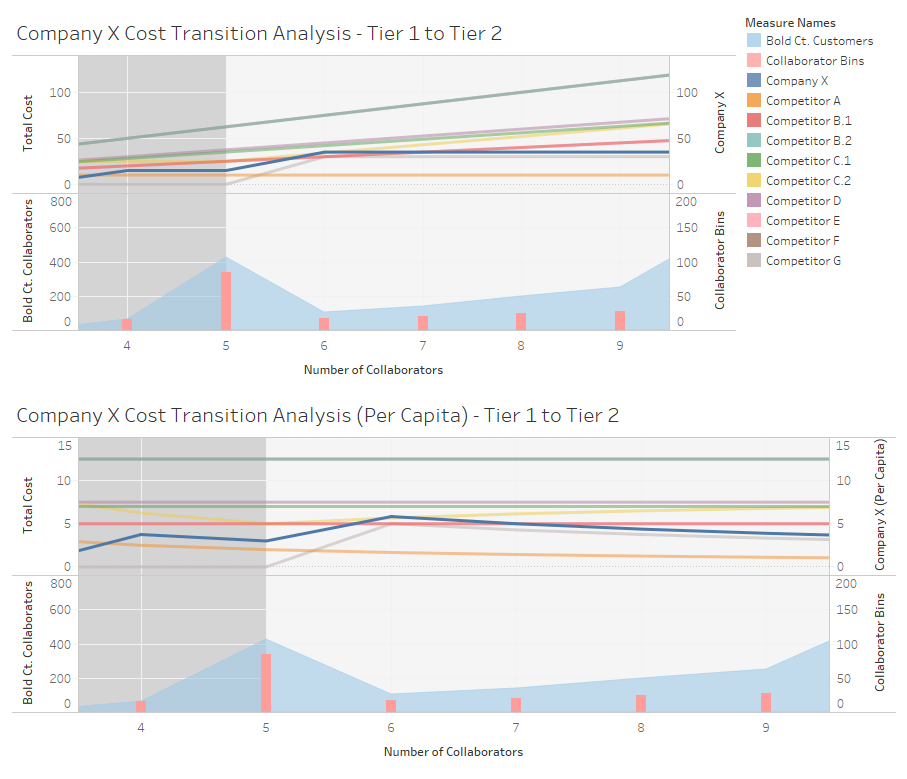
In the transition from Tier 1 to Tier 2 there is a surge of 85 organizations who have 5 collaborators apiece, the maximum allowed for Tier 1, for a total of 425 collaborators at the top cusp of this pricing tier.
Recall from Analysis 2 that upward trend (or downward pressure) may be exhibited in this tier.
Observe that there is a ready explanation for downward pressure to stay at pricing Tier 1, as the cost per capita increases from $3.00 per collaborator to $5.83 per collaborator after this transition.
There is also an explanation for churn; when an organizations is transitioning from 5 to 6 collaborators, five competitors offer similar products whose cost per capita is lower:
- Competitor C.2 ($5.62 per collaborator)
- Competitor B ($5.00)
- Competitor E ($5.00)
- Competitor G ($5.00)
- Competitor A ($1.67)

In the transition from Tier 2 to Tier 3 there is a surge of 58 organizations who have 10 collaborators apiece, the maximum allowed for Tier 2, for a total of 580 collaborators at the top cusp of this pricing tier.
Recall from Analysis 2 that upward trend (or downward pressure) was likely exhibited in this tier.
Observe that there is a ready explanation for downward pressure to stay at pricing Tier 2, as the cost per capita increases from $3.50 per collaborator to $6.82 per collaborator after this transition.
There is also an explanation for churn; when an organization is transitioning from 10 to 11 collaborators, two competitors offer similar products whose cost per capita is lower:
- Competitor B ($5.00)
- Competitor E ($5.00)

In the transition from Tier 3 to Tier 4 is the most impactful point of analysis.
There is a surge of 52 organization who have 15 collaborators, the maximum allowed for Tier 3 apiece, for a total of 780 collaborators at the top cusp of this pricing tier - this is the largest bin of collaborators.
Recall from Analysis 2 that upward trend (or downward pressure) was likely exhibited in this tier.
Observe that there is a ready explanation for downward pressure to stay at pricing Tier 3, as the cost per capita increases from $5.00 per collaborator to $9.38 per collaborator after this transition.
There is also an explanation for churn; when an organization is transitioning from 15 to 16 collaborators, six competitors offer similar products whose cost per capita is lower:
- Competitor C.2 ($7.75 per collaborator)
- Competitor D ($7.50)
- Competitor A ($7.00)
- Competitor C.1 ($7.00)
- Competitor G ($6.88)
- Competitor B.1 ($5.00)
- Competitor E ($5.00)

In the transition from Tier 4 to Tier 5 there is a surge of 25 organizations who have 25 collaborators apiece, the maximum allowed for Tier 4, for a total of 625 collaborators at the top cusp of this pricing tier.
Recall from Analysis 2 that upward trend (or downward pressure) was likely exhibited in this tier.
Observe that there is a ready explanation for downward pressure to stay at pricing Tier 4, as the cost per capita increases from $6.00 per collaborator to $11.54 per collaborator after this transition.
There is also an explanation for churn; when an organization is transitioning from 25 to 26 collaborators, four competitors offer similar products whose cost per capita is lower:
- Competitor C.2 ($8.23)
- Competitor C.1 ($7.00)
- Competitor A ($7.00)
- Competitor B.1 ($5.00)
- Competitor B.1 ($5.00)
Note that bin surging stops in Tier 5.
Conclusion
Based solely on pricing and population concentration data, there is sufficient evidence to recommend a restructuring of pricing tiers.
First, population mean implies the expected value of collaborators per organization should fall within tier 4, the location of Company X's target demographic. Market sector information agrees with this expectation, and there is clear upward trend in each pricing tier approaching the target demographic. Yet, 69% of Company X's clients remain in Tiers 1 through 3.
Second, there is incentive for organizations to remain at the top of each of the lower pricing tiers (downward pressure), as doing so offers the lowest cost per capita of any given tier and prevents jumps in organizational cost. This may be encouraging undesirable behaviors, such as multiple collaborators using a single login.
Third, There is significant and unnecessary exposure to potential churn at four critical pricing tier transitions:
- 45% of Company X's organizational clients are facing tier transition in Tiers 1 through 5, representing 29% of all collaborators who use company X's product.
- When organizations consider upgrading from Tier 1 to Tier 2, five competitors offer a lower price than Company X.
- When organizations consider upgrading from Tier 2 to Tier 3, two competitors offer a lower price.
- When organizations consider upgrading from Tier 3 to Tier 4, six competitors offer a lower price.
- When organizations consider upgrading from Tier 4 to Tier 5, four competitors offer a lower price.
The most concerning transition is from Tier 3 to Tier 4, which is believed to be the most significant factor in preventing demographic access based on the evidence in this analysis:
- The top of Tier 3 maintains the highest concentration of collaborators (52 companies at 15 collaborators apiece for a total of 780 collaborators, or 10% of Company X's clientele). Expectation implies companies should be moving into the next tier (upward pressure), but there is a significant plummet in collaborators immediately after tier transition.
- This is the second-highest increase in cost per capita (downward pressure; the highest being the transition from Tier 4 to Tier 5).
- Churn potential is at its highest during this transition, with six competitors offering lower pricing.
- It is possible that downward pressure and churn are producing a multiplicative effect in preventing clients from upgrading tiers.
Further study (with internal data) is needed to fully prove the project manager's hypothesis that Company X's tier-based pricing structure is promoting churn and eroding sales, while simultaneously preventing the company from reaching its target demographic. However, there is an immediate and probable link between pricing tier transition and churn which can be remedied by implementing one of the following recommendations:
- Eliminate tiers and implement a per-collaborator pricing scheme, aiming to favor the target demographic.
- Decrease the resolution of tiers, paying special attention to the downward pressure and churn potential of Tiers 3 and 4.
- Increase the resolution of tiers, paying special attention to the downward pressure and churn potential of Tiers 3 and 4.
- Reevaluate the current tiers in an effort to reduce cost per tier, paying special attention to the downward pressure and churn potential of Tiers 3 and 4.